


Around 50-60 percent of international trade involves bilateral “trade credit” extended by the exporter to the importer, or vice versa, and 60-70 percent of this credit is denominated and settled in currencies that are foreign to both the importer and exporter. Foreign currency (FX)-denominated trade, in turn, exposes these firms to exchange rate or “FX” risk. Despite this, there is no systematic study of hedging techniques, and due to data limitations, the existing literature has a large-firm bias. In this article, I summarize the key findings of a survey of hedging and hedging instruments from the perspective of small and medium-sized enterprises (SMEs).
From a payment perspective, international trade is riskier than domestic trade.[i] Notwithstanding issues related to the difficulties in understanding foreign legal systems in the event of default or delay, and counterparty default risk (which I will not touch upon in this article), trades take longer to execute, and they have a longer cash-to-cash cycle.[ii] For example, it is not uncommon for goods to spend approximately two months in transit. Longer transportation times lead to higher working capital requirements:[iii] that is, firms rely more extensively on trade payables (credit extended by their suppliers) to finance goods that have been produced but not yet delivered.[iv]
This time lag, coupled with the use of FX for invoicing, implies that firms that trade internationally are often exposed to exchange rate revaluations of their committed cash flows (trade receivables and payables), or “cash flow exposure.” The uncertainty of currency movements affects the firm’s capacity for planning and budgeting by generating unpredictable cash flows and volatile earnings. This is a big concern for companies doing business abroad.[v]
To give a couple of illustrations:
- In an interview for KPMG,[vi] Philippe Balducchi, Head of Airbus Finance Operations noted:
“We sell our aircraft in US dollars while some of internal costs are in Euros, so the strengthening of the US dollar actually has a strong and positive influence on our financial results.”
- In 2003, Volkswagen lost $1.5 billion (i.e., around half of the previous year’s profits) due to an unprecedented rise in the euro-dollar exchange rate (EUR/USD). The reason was Volkswagen’s decision to hedge only 30 percent of its FX exposure, as opposed to the 70 percent it had traditionally hedged.[vii]
Firms have a number of techniques and instruments at their disposal to mitigate this volatility. The most common tools are currency derivatives, like FX forwards (“financial hedging”); and matching future FX-denominated revenues with costs (“operational hedging”). The literature on hedging, however, tends to focus on large firms and, to my knowledge, no systematic study on the topic exists. In this post I will focus on FX forwards hedging and operational hedging as the two tools most suited to SMEs.
Financial hedging: FX forwards
A FX forward is a bilaterally negotiated contractual agreement to buy or sell one currency at a certain future date and at an agreed exchange rate.[viii] Thus, for example, exporters can contract today to sell the foreign exchange proceeds they expect to receive at a future date, so as to insulate themselves from fluctuations in the exchange rate in the interim.[ix] The forward contract enables an exporter to “lock in” an exchange rate that will apply to its future export earnings, with this locked-in rate being similar to the spot rate at the time the contract is taken out. An importer can also use a forward contract; in this case the firm will agree to buy FX at a future date in order to pay for the products that it intends to import.[x]
The empirical literature suggests that firms use FX derivatives most commonly to hedge cash flows, both committed (AC receivable/payable) and expected or forecasted. The table below breaks down the type of exposure being hedged by type of instrument. There is a clear link between maturity and hedging using FX forwards and FX options.

Figures represent percentage respondents from a sample of non-financial German firms.[xi]
According to the Bank of International Settlement Derivatives Statistics database, around 70 percent of the FX derivatives contracts entered into by non-financial firms have a maturity of less than one year. This is consistent with the table below. This confirms the intuition that financial hedging is used mostly to hedge cash flow (short-term) exposures which, as shown previously, have a very similar range of maturities.

Average horizon covered using FX derivatives. The sample consists of 128 firms from the various countries[xii]
In terms of types of industries, a general rule of thumb is that firms which “own” the goods they are selling, such as forestry firms, tend to hedge (using FX derivatives) for relatively long periods, while “margin firms,” such as meat producers, tend to hedge for shorter periods.[xiii] For example, among New Zealand firms, those in the forestry industry will hedge forward up to 18 months, wool industry firms hedge forward up to 6 months, while manufacturers “tend to always hedge confirmed orders”. A further example:
“[Australian] exporters typically tend to hold longer hedging contracts compared with importers…that this is especially true of the mining sector is likely to be a result of the long-term supply contracts that mining companies tend to engage in and the durability and homogeneous nature of some commodities.”[xiv]
The data show that 60 percent of non-financial firms around the world use financial derivatives, with the most popular type being currency derivatives (44 percent).[xv] In the US, 41 percent of non-financial firms use FX derivatives,[xvi] while the figure for UK firms is 74 percent.[xvii] A paper[xviii] finds that about 76 percent of their firm-year observations use at least one type of derivatives, and about 59 percent use FX derivatives. According to one author,[xix] holdings of exchange rate derivatives (notional amounts) are quite substantial, in most cases amounting to 10-20 percent of revenue. A survey of 359 listed non-financial Swedish firms finds that 50 percent of firms use FX derivatives.[xx]
These numbers are probably biased towards larger firms, since firm size is positively related to derivatives use. Based on the more comprehensive EFIGE dataset (covering almost 15,000 firms with more than ten employees in seven European economies), I estimate that only 9.5 percent of firms reported using derivatives and 17.4 percent reported using “FX risk protection.”

Derivatives use among firms.[xxi]
Firms hedge more when they are more exposed to exchange rate fluctuations through exporting and importing (not very surprising), and particularly during times when these fluctuations are higher.[xxii] Firms with low profitability, high growth opportunities, and higher tax liabilities are more likely to use currency derivatives.[xxiii]
The table below breaks down FX derivatives use by industry. It also includes FX debt issuance for comparison. The authors[xxiv] do not speculate as to why these differences exist.

The sample consists of 277 British non-financial firms. Issuance of FX debt is shown for comparison.[xxv]
A general finding in the literature is that partial hedging, as opposed to full hedging, seems to be the rule.[xxvi]In New Zealand, two authors found that, for a large sample of firms, the average proportion of FX export transactions hedged across all firms is 39 percent.[xxvii] Small firms, by comparison, hedged an average of 33percent of their transactions, while large firms hedged an average of 49 percent.
According to ACCA,[xxviii] large firms (measured by sales) take cover to the greatest degree; perhaps surprisingly, small firms are the next most comprehensive hedgers. Intermediate-sized firms hedge a lower proportion of currency exposures than either large or small firms. Consistent with this, a study that looked at Chilean firms found that that smaller firms display higher coverage than their larger counterparts due to the fact that the latter tend to utilize more ‘natural’ (operational) hedges.[xxix] Similar results were reported for Australian and German non-financial firms (see table).

The sample consists of 100 Australian and 74 German non-financial firms. Numbers are rounded.[xxx], [xxxi]
The next table breaks down the amount of coverage by type of exposures. Short-term exposures (e.g., accounts receivable/payable and anticipated transactions with a below 1-year horizon) are hedged more often and with a higher hedging ratio than longer-term exposures.

Cover (%) refers to the extent to which firms hedge their exposures. The third column is the percentage of firms (among those that use FX derivatives) who ‘frequently’ transacted in the FX derivatives markets for each of these reasons.[xxxii]
This inverse relationship between maturity and cover is confirmed by a survey among New Zealand exporters.[xxxiii] The author finds that the cover declines steadily with maturity, with a cover of 50 percent the first quarter, 25 percent the first year, and less than 10 percent the first two years. The forward cover for imports is a much shorter duration, and the proportion of transactions covered is also lower.
The table below provides additional evidence to back this claim. The survey by Deloitte clearly shows a steady and monotonic decline in cover with maturity as well as in derivative use.
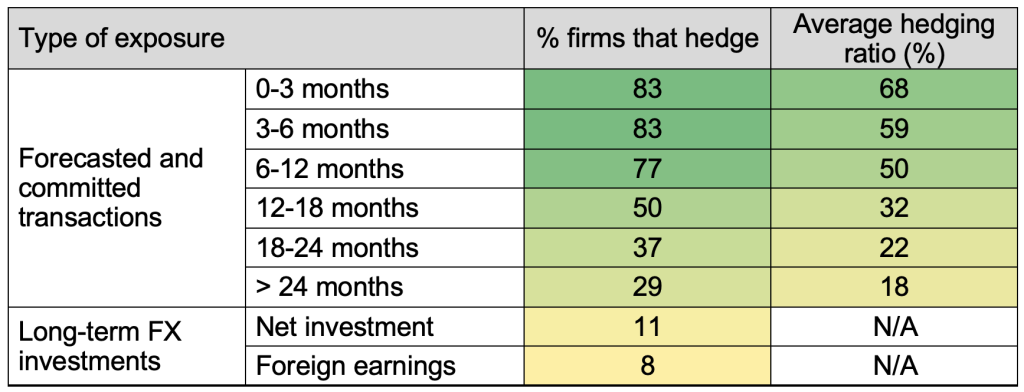
Source: Deloitte Global foreign exchange survey 2016.[xxxiv]
So, we may conclude that both the exposure hedged (hedging ratio or cover) and the hedging frequency (how many firms hedge) using FX derivatives declines steadily with the maturity of the exposure, so that the “effective hedge” declines even more rapidly.
Operational hedging or “matching”
Operational hedging consists of arranging the operations of the firm exposed to FX revaluation effects so that revaluations on the asset side are offset (partially but, ideally, fully) with those on the liability side. As mentioned, in the case of SMEs, the assets and liabilities that are FX-denominated tend to be, overwhelmingly, trade receivables (assets) and payables (liabilities); operational hedging, in their case, consists of matching the FX value of both.
For example, a German exporter who prices and settles its exports in currencies other than EUR (for example, USD) would protect itself from FX revaluation effects by importing a similar value of intermediate inputs priced and settled in USD. More precisely, the firm has to match the FX value of its receivables and payables, and it can do so two ways: by adjusting their value and/or by adjusting their maturity.
This is, indeed, what the data show. German firms appear to be excellent operational hedgers, and virtually all revaluations in their trade receivable assets are offset by those of their trade payable liabilities, as shown below, resulting in a very small net FX exposure.

Revaluation flows of trade receivables and payables for the total German economy. Sources: Eurostat, Financial account; Other Investment; Trade credits and advances; Revaluations due to exchange rate changes; and ECB Statistical Data Warehouse.
As it happens, matching is comparatively easier for a country with a substantial trade surplus like Germany. This is due to the fact that exports tend to be denominated in local currencies (EUR) to a greater extent than imports (what is known as “Grassman’s law”).[xxxv] Also, the greater a country’s manufacturing sector’s exports to another country (relative to total manufacturing sales in the importer country, i.e., market share), the greater the fraction of those exports that will be invoiced in the exporter’s country.[xxxvi] A country’s market power, measured in terms of a country’s world export share or GDP, also leads to increased invoicing of its home currency.[xxxvii]
Not all countries are as good at operationally hedging as Germany, however. This is shown in the heat map below, which computes the ratio of exchange rate revaluations of trade receivables divided by exchange rate revaluations of trade payables. The closer this ratio is to 1, the better of an operational hedge each country has (green); the further the ratio is from 1, the worse an operational hedger (red). While Germany and Italy come up on top of the ranking, Lithuania and Denmark come up at the bottom. Note that these data refer to whole countries and not to specific sectors (e.g., non-financial firms) within them.

Operational hedging heat map. The figures refer to the total economy of each country. Sources: Eurostat, Financial account; Other Investment; Trade credits and advances; Revaluations due to exchange rate changes; and ECB Statistical Data Warehouse.
The heat map shows where, in the “FX receivables-payables space,” Norwegian non-financial firms are located. Firms clearly locate along the diagonal, implying a fairly good hedge between FX receivables and payables. Something to note is that, given that revenues and costs are not equal, this figure cannot tell us whether the net exposures are being completely hedged – but it does suggest that a good fraction of their exposure is.

Sample consists of 438 Norwegian firms.[xxxviii]
Another possibility is to match revenues with costs using currencies that, though different, can co-move, i.e., they follow a similar pattern of appreciation and depreciation vis-à-vis the functional currency. As pointed out by Tscheke,[xxxix] and operational hedge of this kind requires firms to “intentionally choose export and import regions with co-moving currencies”.
Another straightforward way for SMEs to avoid FX revaluations is by denominating as much of their trade receivables and payables in their local currency in the first place or by passing through the cost to their buyers when FX rates move, which could be considered operational hedging. At the extreme, a complete pass-through would be equivalent to USD settlement but EUR invoicing/pricing. However, exporters rarely adjust their selling prices to offset all revaluation effects, at least not instantaneously. Abundant empirical research demonstrates that exchange rate pass-through to import prices is less than complete.[xl] It has been estimated that, for a large sample of the Organization for Economic Co-operation and Development countries, on average import prices in local currencies reflect 61 percent of exchange rate fluctuations in the first quarter, and nearly 77 percent over the long-run.[xli] According to the authors:
“…partial pass-through is overwhelmingly the best description of import price responsiveness shortly after an exchange rate movement’ and in the longer run, pass-through elasticities are closer to one, although complete pass-through…is still rejected for many countries.”

Exchange rate pass-through into import prices. The short-run refers to less than one quarter.[xlii]
Besides, pass-through is considerably higher when the exporter invoices in its functional currency,[xliii] unlike the case of our German exporter. Some authors[xliv] find that this to be the case of US exports, with 84 percent pass-through for dollar-denominated trade and 25 percent for non-dollar denominated trade two years after the exchange rate shock. A report by the ECB[xlv] finds that an increase in the share of the euro as an invoicing currency for extra-euro area imports by 10 percentage points lowers the degree of exchange rate pass-through by close to 7 percentage points. Other authors[xlvi] find a clear positive correlation for eleven countries between pass-through and the share of exports invoiced in the exporter’s currency. Similar evidence has been found for Japanese exporters:
“Firms with yen invoicing tended not to change export prices, while firms with dollar invoicing tended to have made price revisions.”[xlvii]
This suggests that facing a devaluation of its currency, the exporter does not reduce its price to offset it—at least not fully—and the importer bears the cost of having to pay with a depreciated currency. On the other hand, when the exporter invoices in the importer’s currency, the pass-through (price revision) is lower.
A possible reason for this is that, in doing so, the exporter risks losing market share and causing a drop in sales.[xlviii] Some authors[xlix] have hypothesized that a firm’s ability to pass-through the effect of movements in exchange rates depends on the elasticity of demand, which, in turn, depends on the degree of product differentiation; management strategies for firms with differentiated products may, therefore, differ from those who seek to compete on cost leadership. For example, some authors[l] find that large high-market-share firms adjust their mark-ups (and thus, their selling prices) in response to cost shocks arising from exchange rate changes. Using French firm-level data, others[li] find that high-performance (more productive) firms react more strongly to exchange rate movements by increasing their mark-ups and less so by decreasing their export volumes relative to less productive firms, suggesting that high-performance exporters pass on a higher proportion of exchange rate fluctuations to their customers. For a sample of Swiss firms, some authors[lii] find that differentiated and customized products, such as machinery and equipment or rubber and plastics products, generally have higher pass-through from increases in the prices of their imported intermediate inputs to their exports. A report by the ECB[liii] finds that economies which import more low-technology products tend to have lower pass-through:
“This may reflect the fact that exporters of less differentiated products tend to have lower market power and hence react to depreciation by increasing their mark-up rather than their export volume, which translates into a lower exchange rate pass-through.”
These facts suggest that actively revising the selling price to match a rise in costs is considered bad manners, and firms are careful not to overdo it. Nonetheless, passing-through seems to be used by firms quite frequently—at least as a cushion (partial offsetting) mechanism.
Finally, similar to what happens to the price of domestic goods, there is an asymmetry in the response of firms to exchange rate movements. After examining 19 US industries, two authors[liv] conclude that firms in over half the industries respond asymmetrically to appreciations and depreciations, but that there is no predominant direction in the asymmetry. They also find that large exchange rate movements lead to higher pass-throughs, in line with the findings of one author[lv] for Japanese export prices. More generally, using a survey of 11,000 firms in the euro area, authors have found[lvi] that cost shocks are more relevant in driving prices upwards than downwards, while shocks to market conditions (changes in demand and the competitor’s price) matter more for price decreases than for price increases. They also find that prices tend to change more frequently in the traded sectors than in services.
***
Borja Clavero is a Banking Consultant at Local First (“Promoting local banks”), FinTech Consultant at PSP Lab, and PhD student at De Montfort University.
This post is adapted from his paper, “Hedging of currency exposures: Lessons for SME exporters and importers,” available on SSRN.
The views expressed in this post are those of the author and do not represent the views of the Global Financial Markets Center or Duke Law.
[i] DIE (2015), ‘Financing global development: The potential of trade finance’, German Development Institute, Briefing Paper
[ii] RBS (2011), Guide to international trade: Supporting your global ambitions, p. 28
[iii] Antràs, P., and C.F. Foley (2014), ‘Poultry in motion: A study of international trade finance practices’, Journal of Political Economy
[iv] Amiti, M., and D.E. Weinstein (2009), ‘Exports and financial shocks’, Centre of Japanese Economy and Business, Working Paper Series, December 2009, No. 287
[v] RBS (2011), Guide to international trade: Supporting your global ambitions, p. 15, 34.
[vi] KPMG (2016), Growth and uncertainty: Highs and lows in the Aerospace and Defence sectors, p. 11
[vii] Macwan, M. (2010), ‘Volkswagen hedging strategy and 2003 crisis’
[viii] Barumwete, L.A., and F. Rao (2008), ‘Exchange rate risk in Automobile Industry: -An Empirical Study on Swedish, French, and German Multinational Companies’. Umea School of Business, Master Thesis
[ix] Brookes, A., D. Hargreaves, C. Lucas and B. White (2000), ‘Can hedging insulate firms from exchange rate risk?’, Reserve Bank of New Zealand Bulletin, Vol 63, No 1, March, 21-34, Reserve Bank of New Zealand, Wellington
[x] Briggs, P. (2004), ‘Currency hedging by exporters and importers’. Reserve Bank of New Zealand Bulletin, Vol. 67, No. 4
[xi] Bodnar, G., and G. Gebhardt (1998), ‘Derivatives Usage in Risk Management by U.S. and German Non-Financial Firms: A Comparative Survey,’ NBER Working Paper No. 6705
[xii] Uth, M.L., and T. Enevoldsen (2011), ‘The time horizon of foreign exchange rate exposure management: An empirical investigation of the factors influencing the hedging horizon in medium-sized and large, non-financial companies in Scandinavia’. Master Thesis. Aarhus University, Table 9
[xiii] Briggs, P. (2004), ‘Currency hedging by exporters and importers’. Reserve Bank of New Zealand Bulletin, Vol. 67, No. 4
[xiv] Becker, C., and D. Fabbro (2006), ‘Limiting foreign exchange exposure through hedging: The Australian experience’, Reserve Bank of Australia Research Discussion Paper, 2006-09
[xv] Bartram, S. M., G. W. Brown, and F. R. Fehle (2009). International evidence on financial derivatives usage. Financial Management 38 (1), 185–206.
[xvi] Geczy, C., Minton, B.A., and Schrand, C., (1997), ‘Why firms use currency derivatives’, Journal of Finance, 52, 4, 1323-1353.
[xvii] Muff, T., S. Diacon, and M. Woods (2008), ‘The management of currency risk: Evidence from UK company disclosures’, Centre for Risk and Insurance Studies
[xviii] Kuzmina, O., and O. Kuznetsova (2017), ‘Operational and financial hedging: Evidence from export and import behaviour’. CEFIR/NES Working paper series, WP No 242, July 2017
[xix] Döhring, B. (2008), ‘Hedging and invoicing strategies to reduce exchange rate exposure: A euro-area perspective’. European Commission Economic Papers 299, January 2008
[xx] Hagelin, N., and B. Pramborg (2004), ‘Empirical evidence on the incentives to hedge transaction and translation exposure’. Working paper
[xxi] Martin, J., and I. Mejean (2012), ‘Invoicing Currency, Firm Size and Hedging’. CEPII Discussion Papers, No. 2012-28.
[xxii] Kuzmina, O., and O. Kuznetsova (2017), ‘Operational and financial hedging: Evidence from export and import behavior’. CEFIR/NES Working paper series, WP No 242, July 2017
[xxiii] Muff, T., S. Diacon, and M. Woods (2008), ‘The management of currency risk: Evidence from UK company disclosures’, Centre for Risk and Insurance Studies
[xxiv] Muff, T., S. Diacon, and M. Woods (2008), ‘The management of currency risk: Evidence from UK company disclosures’, Centre for Risk and Insurance Studies, Table 3B
[xxv] Muff, T., S. Diacon, and M. Woods (2008), ‘The management of currency risk: Evidence from UK company disclosures’, Centre for Risk and Insurance Studies, Table 3B
[xxvi] Aabo, T. (2001), ‘Exchange Rate Exposures and Strategies of Industrial Companies: An Empirical Study’. Thunderbird International Business Review 43(3):379 – 395 · May 2001
[xxvii] Fabling, R., and A. Grimes (2008), ‘Over the hedge? Exporters’ optimal and selective hedging choices’ Reserve Bank of New Zealand
[xxviii] ACCA (2013), Hedging FX risk: Taking stock of the challenge for mid-caps and SMEs
[xxix] Acharán, M G, R Álvarez and J M Villena (2009): ‘Crisis financiera y uso de derivados cambiarios en empresas exportadoras’, Working Papers, no 552, Central Bank of Chile.
[xxx] Benson, K., and B. Oliver (2004), ‘Management Motivations for Using Financial Derivatives in Australia’ Australian Journal of Management, 29(2), 225 – 243
[xxxi] Glaum, M. (2005), ‘Foreign-Exchange-Risk Management in German Non-Financial Corporations: An Empirical Analysis’. Springer.
[xxxii] Bodnar, G.M., Hayt, G.S., Marston, R.C. (1998), ‘1998 Wharton survey of financial risk management by U.S. nonfinancial firms.’ Financial Management 27, 70 – 91.
[xxxiii] Briggs, P. (2004), ‘Currency hedging by exporters and importers’. Reserve Bank of New Zealand Bulletin, Vol. 67, No. 4
[xxxiv] Deloitte (2016), Continued evolution: 2016 global foreign exchange survey
[xxxv] Kamps, A. (2006), ‘The euro as invoicing currency in international trade’, Working paper series No 665 August 2006; Genberg, H. (2011), ‘Currency internationalisation: analytical and policy issues’. Chapter in Currency internationalisation: lessons from the global financial crisis and prospects for the future in Asia and the Pacific, 2011, vol. 61, pp 221-230 from Bank for International Settlements; Ito, H., and M. Chinn (2015), ‘The Rise of the Redback: Evaluating the Prospects for Renminbi Use in Invoicing’. In: Eichengreen, B., and M. Kawai (2015), Renminbi Internationalization: Achievements, Prospects and Challenges, Asian Development Bank Institute, Brookings Institution Press, 2015; Ligthart, J.E., and J. Da Silva (2007), ‘Currency Invoicing in International Trade: A Panel Data Approach’, No 2007-25, Discussion Paper from Tilburg University, Centre for Economic Research
[xxxvi] Bacchetta, P., and E. van Wincopp (2005), ‘A theory of currency denomination of international trade’, Journal of International Economics 67 (2005) 295 – 319
[xxxvii] Ligthart, J.E., and S.E.V. Werner (2012), ‘Has the euro affected the choice of invoicing currency?’. Working paper series, No 1414, January 2012; Kamps, A. (2006), ‘The euro as invoicing currency in international trade’, Working paper series No 665 August 2006
[xxxviii] Eriksen, K., and O. Wedøe (2010), ‘Foreign exchange risk management: How are the largest non-financial companies in Norway managing their foreign exchange rate exposure?’, Norges Handelshøyskole, Bergen, June 2010, p. 64
[xxxix] Tscheke, J. (2016), ‘Operational hedging of exchange rate risk’, Münchener Wirtschaftswissenschaftliche Beiträge (VWL) 2016-18
[xl] Flodén, M., and F. Wilander (2005), ‘State dependent pricing, invoicing currency, and exchange rate pass-through’. Journal of International Economics 70 (2006) 178 – 196
[xli] Campa, J.M., L.S. Goldberg (2002), ‘Exchange rate pass-through to import prices: A macro or micro phenomenon?’. New York Fed, working paper
[xlii] Campa, J.M., L.S. Goldberg (2002), ‘Exchange rate pass-through to import prices: A macro or micro phenomenon?’. New York Fed, working paper
[xliii] ECB (2015), The international role of the euro, July 2017, p. 44
[xliv] Gopinath, G., Itskhoki, O., and Rigobon, R. (2010), ‘Currency Choice and Exchange Rate Pass-Through’. American Economic Review, 100(1):304{36.
[xlv] ECB (2015), The international role of the euro, July 2017, p. 44
[xlvi] Cui, L., C. Shu, and J. Chang (2009), ‘Exchange rate pass-through and currency invoicing in China’s exports’. China Economic Issues, No 2/09, July 2009
[xlvii] Ito, T., S. Koibuchi, K. Sato, and J. Shimizu (2015), ‘Choice of Invoice Currency in Japanese Trade: Industry and commodity level analysis’. Center on Japanese Economy and Business, Working Paper Series, April 2015, No. 343
[xlviii] Antoci, V. (2015), ‘Managing transaction exposure in MNCs’
[xlix] Sundaram, A., Mishra, V., (1991), ‘Currency movements and corporate pricing strategy’. In: Khoury, S., (Ed.), Recent Developments in International Banking, Elsevier, Amsterdam, 203–241
[l] Amiti, M., O. Itskhoki, and J. Konings (2014), ‘Importers, exporters, and exchange rate disconnect’. American Economic Review, July 2014, 104(7): 1942-78
[li] Berman N., Martin, P. and Mayer, T. (2012), ‘How do Different Exporters React to Exchange Rate Changes?’ The Quarterly Journal of Economics, 127(1), pp. 437-492
[lii] Fauceglia, D., A. Shingal, and M. Wermelinger (2012), ‘Natural hedging of exchange rate risk: The role of imported input prices’. Working paper
[liii] ECB (2015), The international role of the euro, July 2017, p. 49
[liv] Pollard, P.S., and C.C. Coughlin (2003), ‘Size Matters, Asymmetric Exchange Rate Pass-Through At The Industry Level’. Federal Reserve Bank of St. Louis Working Paper 2003-029B
[lv] Ohno, K. (1989), ‘Export Pricing Behavior of Manufacturing: A U.S. – Japan Comparison,’ IMF Staff Papers 36(3), 550-579
[lvi] Fabiani, S., M. Druant, I. Hernando, C. Kwapil, B. Landau, C. Loupias, F. Martins, T.Y. Mathä, R. Sabbatini, H. Stahl and A.C. J. Stokman (2005), ‘The pricing behaviour of firms in the euro area: New survey evidence’. ECB Working Paper Series, No. 535, October 2005