


We are now one year into the global health and economic crisis caused by Covid-19, and its toxic impact on society continues. Before examining the virus’ impact on the credit cycle, it is imperative to first understand where credit markets were prior to this crisis. Analyzing that environment will help us to evaluate the immediate and subsequent events, and pave the way for a 2021 outlook.
As of December 2019, most developed economies, and certainly the U.S., were clearly in a benign credit cycle. How to determine if the corporate credit cycle is benign, or stressed, or in a crisis, requires analysis of five financial factors. A benign credit cycle exists if: (1) corporate defaults in the high-yield (HY) bond market are below the historic average of 3.3%, (2) recoveries to investors who own these securities are above 45%, (3) the required yield spread on HY bonds or leveraged loans by investors is below the historic average rate of 5.2%, (4) the “distress ratio” (a measure I first developed in 1990 that measures the percentage of HY bonds selling for more than 10% above the duration equivalent Treasury bond rate) is below 10%, and (5) liquidity in the risky debt market is abundant, particularly new issuance for the most risky debt (I.e., B- and CCC rated bonds and loans).
If all, or most of these factors are signaling benign, then we are enjoying a growth oriented benign environment. As of December 2019, we were certainly in this favorable condition and had been for almost the entire post-Great Financial Crisis (GFC) period, starting in mid-2009. The outlook in early 2020 projected a continuation of this unprecedentedly long “risk-on” environment.
Yet, at year-end 2019 the global credit markets were extremely vulnerable to a much more stressed cycle period – all that was lacking was a catalyst. Indeed, the amount of corporate non-financial debt as a percentage of GDP (NFCD/GDP), in the U.S. and on a global level, was at a record high level and had been growing dramatically over the past 20 years. Global government debt also had seen similar growth but most policy-makers were unconcerned because of low interest-rates and defaults rates. One could argue that a good deal of the world’s GDP growth in the past 10 years was due to this low interest-rate climate and had little to do with productivity gains.
Importantly, every time we observed that the NFCG/GDP ratio rose to a temporary peak, a surge in corporate defaults followed within 12 months, and for the last three spikes, default rates exceeded 10% per year for one or usually two years. These spikes in bankruptcies followed peaks in NFCD/GDP (see Figure 1) and were always coincident with economic recessions, although default rate increases to above historic average levels, oftentimes preceded the onset of the recession. So, the formula for the last three credit market crises were debt explosions and a recession leading to the end of benign credit cycles. Both were necessary! The catalysts were (1) the LBO mania causing unrealistic asset values in 1990-1991, (2) the bursting of the tech bubble and 9/11 in the early 2000s and (3) the mortgage debt and banking industry “Great Financial Crisis” (GFC) that began in 2008.
Figure 1: U.S. Non-financial Corporate Debt/GDP (Comparison to 4-Quarter Moving Average Default Rate)
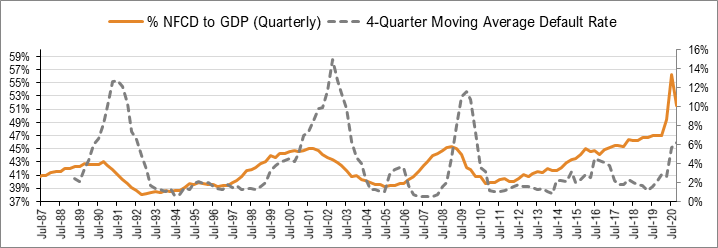
Sources: FRED, Federal Reserve Bank of St. Louis and Kroll Bonding Rating Agency/Altman High-Yield Default Rate data.
COVID-19 Pandemic Impact on the Credit Cycle in 2020
Once Covid-19 hit the U.S, the health and economic climate changed at an unforeseen pace. Within a few short weeks we went from a benign credit cycle to a highly stressed environment. Corporate large firm defaults escalated, equity prices plummeted, dropping by over 30%, and debt prices at all credit levels went into free-fall. Credit spreads spiked from about 400 basis points to almost 1100 basis points for high-yield bonds with investment-grade bonds following suit, particularly for those downgraded to junk status. The Distressed Ratio climbed from below 10% to 35% and liquidity dried up almost overnight. Uncharacteristically, the NBER declared that the U.S. economy was in a recession starting in February – normally it takes two consecutive quarters of negative GDP to motivate such a strong statement, but the GDP and unemployment outlook was so bleak that the “recession” label was forthcoming.
High-yield bond default rate forecasts from some market professionals surged from an expected 2020 rate of below the historic average of 3.3% to double digits – my forecast also increased to 7-8% based on a three-factor model and what I expected to happen with “fallen-angel” downgrades. Recovery rates changed from about an average (45%) level to near 30% with similar drops in recoveries on defaulted leveraged loans. As noted, yield spreads and the distressed ratio spiked and no longer could B- and CCC rated companies access the new issue market. Indeed, the entire junk bond market froze.
Remarkably, the Federal Reserve Bank’s Board of Governors reacted almost immediately with unprecedented speed and actions by lowering interest rates, and for the first time, promising to purchase newly issued IG bonds and fallen angel debt in the secondary markets that was downgraded after March 22nd. As the economy went into a lockdown, the Fed backed by Congress and the U.S. Treasury, also guaranteed low-interest rate loans to small and medium sized enterprises through a special lending program. This was followed quickly by a Congressional fiscal stimulus package of about $2 trillion, more than twice what Congress had passed during the GFC. These actions worked quickly and probably with more success than any of the policymakers envisioned. The initial and subsequent Fed support spawned a tremendous rebound in financial markets, which has continued to this very day, even after the U.S. Treasury’s backstopping of Fed actions ended at year-end.
Despite continuing price volatility and real economy/unemployment malaise, corporate financial market debt new issuance exploded almost immediately. For the first time in my experience of more than 50 years studying credit markets, we witnessed huge increases in in debt during a recession, during the worst pandemic in a century and during an economic crisis! Usually, the antidote to an economic/credit crisis is the reverse, namely a deleveraging.
The BBB Phenomenon
Remarkably, BBB-rated debt has been growing far more than any other rating class in the last 15 years, now totaling about $3.5 trillion, up from just $0.5 trillion in 2005! It appears that corporate Treasurers and their investment bank advisors are targeting BBBs as their “rating of choice”. The reasons are the low interest rates even for the lowest of the investment-grade (IG) class and the markets continuing search for yield even amongst the more conservative IG investors. Rating agencies seemed reluctant to downgrade these BBB bond issuing firms to junk status, especially before the pandemic, even as leverage levels increased dramatically.
Rating agencies were unanimous that the next downturn would see a maximum of 10% fallen-angel downgrades over a 2- to3-year downturn. Instead, utilizing my Z-Score credit risk models, both Z and Z”, and their Bond Rating Equivalents (BRE) to analyze the population of BBBs at year-end 2019, I found that as much as 35% of BBBs did not “deserve” the lofty IG status, but looked more to me like BB or B rated companies. Of course, I knew that the agencies would not downgrade that many bonds, but perhaps 20% ($550-600 billion) could be downgraded if the markets went into a highly stressed mode. This would increase the high-yield bond market by about 1/3, to over $2 trillion! The result could lead to a “crowding-out” effect on the riskiest segment of junk-bonds, i.e. the CCCs, and increase defaults perhaps significantly and the rate of default by an additional 1%. Hence, my forecast for 2020 default rate changed to between 7-8%. By year-end 2020, the annual fallen-angel total reached about $350 billion of global downgrades with many household corporate names, such as Macy’s, Delta Airlines, Occidental Petroleum, Carnival Cruise Lines, Rolls Royce and Marks & Spencer becoming “junk” (see Table 1). The $600 billion amount by the end of 2021 did not seem so farfetched.
Table 1: Fallen Angel Z and Z’’-Scores and their Bond Rating Equivalent (BRE) – May 2020
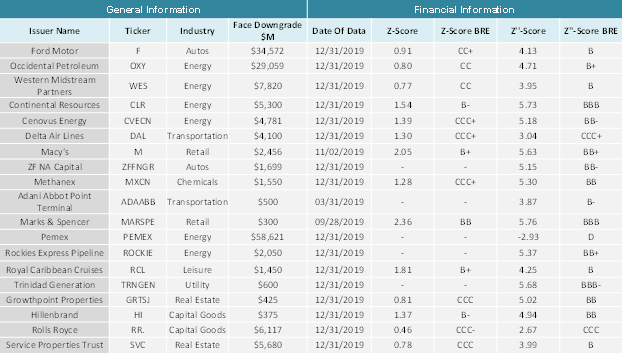
Source: E. Altman, NYU Salomon Center, Capital IQ (S&P)
A related issue emerged as to whether the market was experiencing a type of rating-inflation with so many questionable BBBs in 2019. I looked at this issue and concluded that no, there was no inflation of BBBs since that 35% undeserved proportion was fairly constant over the last two decades. Perhaps a better label for this phenomenon was a “rating over-valuation” when it comes to whether to rate a bond issuer as IG or high-yield (HY)?
Remarkably, just like the stock and bond market rebound, the number and amount of BBB downgrades also came to a screeching halt, especially since the economic outlook improved as lockdowns were lifted, vaccine outlook improved and the Fed actions on fallen angel bonds were absorbed by market participants. I am still concerned about a second wave of IG downgrades since the economy ended 2020 with a negative 3.5% GDP growth and the nation’s growth stalled in Q4-2020 and into 2021 and with the continued explosion of new HY and IG debt. Indeed, in 2020 there were $435 billion new issue amount of HY bonds, easily breaking the historic record for new issuance by almost $100 billion, and a near record $2 trillion of IG bonds. Similar, but not as spectacular, growth in leveraged loans kicked-in in the second half of 2020. All of this new issuance during a pandemic! U.S. Non-Financial Debt as a percentage of GDP spiked to almost 57% as of mid-2020 and was still over 50% as of year-end. The previous level of this important statistic, even in a low interest rate environment, was 47% at the end of 2019.
Defaults and Bankruptcies in 2020 and Outlook in 2021
While the toll of U.S. large firm defaults in 2020 was not as dire as all forecasters estimated in spring 2020, default rates on HY bonds and leveraged loans did spike to 6.7% and 5.7%, respectively. These stats are based on our compilation of a dozen forecasting institutions (see Table 2). This was almost triple the rate in 2019 and double the historic average annual rate, but short of what we normally see in a credit crisis.
The same 12 forecasters estimated high-yield bond and leveraged loan default rates for 2021, first as of January 1, 2021 and then two months later, as of March 1, 2021. The consensus estimate as of 1/1/2021 was 5.2% for the high-yield bond default rate and 5.1% for leveraged loans. My estimate, based on three methodologies, (1) mortality rates, (2) yield spreads and (3) distress ratios, (the latter two based on regression analysis), was 4.6% for 2021. While still above the historic average, it is clearly lower than the rate in 2020.
Then 2021 began in a fairly benign state and most forecasters revised their 2021 default rate estimates downward, as shown as of 3/1/2021 in Table 2. The consensus revised estimates, for those who did provide revisions, was 4.5% for HY bonds, a drop of 0.7 percentage points. My own forecast decreased to 3.8% from 4.6%. There were no revisions for leveraged loans.
Table 2: Forecasted 2021 High Yield Bond & Leverage Loan Default Rate – As of Jan 1, 2021
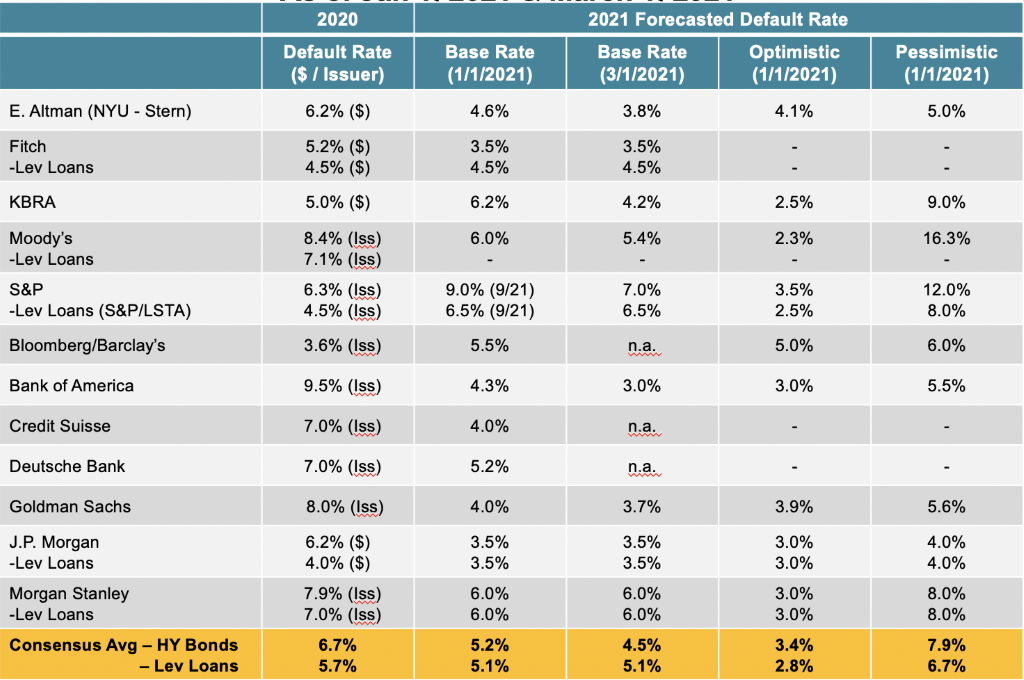
Sources: Data Compiled by the author From Various Forecasting Services
Despite default rates not reaching record levels in 2020, large firm bankruptcies did! 180 firms with liabilities greater than $100 million and 60 firms with liabilities greater than $1 billion filed for Chapter 11 bankruptcy protection, far exceeding the previous records in 2009 (see Table 3). Surprisingly, to some observers, small and medium-sized firm bankruptcies were considerably lower than in 2019, as government stimuli loan forbearance, and loan forgiveness supported debtors (see our section below on “zombie Firms”). The number of fallen-angels which increased dramatically after the first few months of the pandemic, dropped considerably in the second half of the year.
Table 3: 2020 U.S. Large Firm Bankruptcy Filings
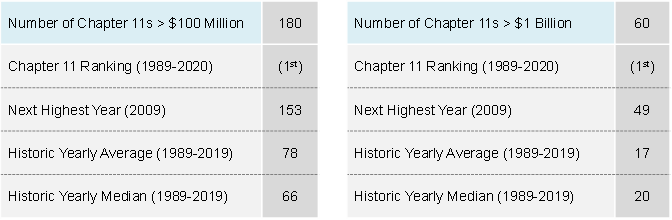
Source: E. Altman (NYU Stern Salomon Center) and KBRA, using data from New Generation Research, Boston, MA
What about 2021? While we have shown that all forecasters believe that default and bankruptcy rates will decrease from 2020 levels, and most macro pundits agree that economic expansion will escalate in the second half of the year, I am not as convinced that defaults will return to normal levels – especially for small and medium-sized firms and individuals. The Biden Administration’s support of the economy, via a large $1.9 trillion stimulus package will, among many other items, continue support for small and medium sized firms and individuals, but new stimuli will probably not be forthcoming in the second half of 2021, except for infrastructure finance. Bankruptcies, especially for smaller enterprises, will see a new wave as their zombie status becomes clearer and this new wave could very well occur toward the end of the year and/or into 2022.
Zombie Firms
An emerging global issue is the controversy over the amount and consequences of “zombie firms” that clearly have been increasing during the current pandemic. This phenomenon of firms kept artificially alive by regulators, banks, investors, and policymakers have been increasing now for perhaps two decades. This assertion is based on empirical observation. The concept of “walking dead” firms begs the questions of measurement and consequences. Several academic papers, the BIS, and institutional studies have sounded the alarm about zombie-growth and lamented the misallocation of resources that results when governments and financial institutions keep entities out of the bankruptcy courts and delay likely liquidation. The main argument in support of these bailouts is to preserve jobs and hopefully give the debtor time to restructure or simply improve its revenues and profits once the economic stressed period during recessions and/or pandemics subsides. The opposite point of view is that the global economy would be better off to let failing companies perish and creditor recoveries be reinvested in more productive enterprises. A further, less clear but important, argument is that “zombie firms” are a contributing factor to global dis-inflation, a problem that has become painfully evident in Japan in the 1990s and more recently in many European countries. This argument goes that zombie firms attempt to survive by lowering prices on their goods and services only to be met by lower prices from their stronger and more resilient competitors providing a destructive cycle of deflation and lower aggregate growth.
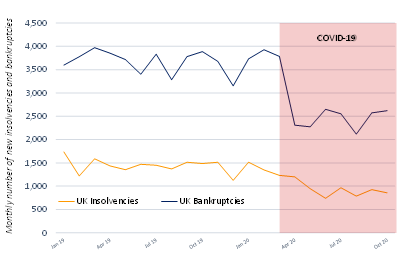
Nobody would deny that artificial support of failing companies, for example specific regulations where small and medium-sized firms receive lower than market interest rate subsidies, or special tax benefits to invest in struggling companies, propel zombie firms. We certainly have experienced this during the COVID-19 period on a global scale. Some countries, for example in Europe, are prohibiting bankruptcy filings and/or providing moratoriums on interest payments, at least in 2020 and into 2021. (See Figure 2 for a remarkable drop in bankruptcies and insolvencies in the U.K. during COVID-19.) When these prohibitions end, what will be the result? No doubt, a spike in non-performing loans on creditor balance sheets, which may or may not require government subsidies or bailouts for the banks and other lenders.
Figure 2: Mind the Zombies
How to measure zombie numbers is a tricky exercise. Most “zombie-watchers” identify these firms if they cannot “cover” their debt-interest costs or principal repayments with profits or cash flows, i.e., if the ratio of earnings, or cash flows, relative to interest is < 1.0, for 2-3 years. Results of several studies have shown that this occurrence has been increasing steadily in many countries over the last two decades, even in relatively more successful countries, like the U.S. Indeed, by this criterion, some countries have an astonishingly high percentage of over 20% of listed companies with coverage trends less than 1.0! And what about the vast majority of private, non-listed companies? I believe these findings are coincident with my earlier discussion about the explosion in corporate non-financial debt, even in a low interest rate environment.
While less than 1.0 coverage ratios are a useful starting point in identifying zombie firms, I prefer to add a second filter that is a more difficult hurdle to achieve, namely a failed test from a model that analyzes < 1.0 coverage firms that are also not likely to survive. In our case, we assess my Z-Score models on the target ailing companies and assess their bankruptcy prediction levels. Preliminary results show that in many countries of the world, the percentage of zombie firms by this two-step definition are, on average, 8% of listed companies – less than half of what the coverage ratio test shows. We plan to address the non-listed population in our analysis, as well as in future reports. These numbers of possible zombies are still “impressive”.
Conclusion
Most economists and policymakers feel that the worst of the economic impact of COVID-19 is over as we move into 2021 and vaccines become more available globally. The recovery will not be uniform across countries and within economies. My concern remains with the excessive debt levels of companies and governments, a product of at least two decades of reliance on leverage to grow the global economic system. I am also concerned about the after-effects of government and creditor support, both bank and non-bank, once these supports lessen or vanish. Companies, if they can, should start reducing these debt levels now when cash flows are increasing or levels of existing cash are sufficient to do so. There is no better time to issue new equity financing than today, when equity prices are at record high levels.
Edward Altman is a Professor Emeritus at the NYU Stern School of Business
*This is an update and extended Blog by the author to his June 2020 publication “COVID-19 and the Credit Cycle”, Journal of Credit Risk, 16(2),67-94.